現貨金 - SAR
想像你是順勢交易者,預期金市將出現大升浪,於是在 09年 9月初進場,然後金價果然節節上升。一切看來都很完美,但可惜你選擇了 SAR 作為你的出場訊號,SAR 在 9月 21日發出止賺訊號,你只好在 995美元附近「止賺」,眼巴巴看著金價最後升至 1226美元!
在這裡我想介紹一個較適合中長線投資者的出場指標:Chandelier Exit
現貨金 - Chandelier Exit
圖中所見,面對大漲小回的走勢,Chandelier Exit 能盡量捕捉整個行情,讓投資者享受「贏間廠」的樂趣。
那麼 Chandelier Exit 是基於什麼計算出來的呢?首先大家需要知道什麼是真實波幅 (True Range, TR),每日的真實波幅是以下三者之中的最大值:
1. 當日最高至最低的幅度
2. 當日最高與昨日收市價之間的幅度
3. 當日最低與昨日收市價之間的幅度
得出每日的真實波幅後,我們就可以利用移動平均的概念,計算平均真實波幅 (Average True Range, ATR),以 10天 ATR 為例,一開始先計算過去 10天 TR 的簡單平均值,其後每天的 ATR 將以下面公式計算:
ATR(今日) = [(ATR(昨日)‧9) + TR(今日)] / 10
明白了 ATR 的原理,我們就可以正式計算 Chandelier Exit:
Chandelier Exit = 過去 20天的最高價 - 3‧20天 ATR
舉例,假設現貨金過去 20天的最高價為 1523美元,20天 ATR 為 16美元,Chandelier Exit 計算如下:
Chandelier Exit = 1523 - 3‧16 = 1475
透過公式我們可以知道,若投資者持有好倉,Chandelier Exit 就像懸掛在天花板的吊燈那樣,只有創下新的最高價或 ATR 收窄,止賺位才會上移;另外若市場的波幅擴大,Chandelier Exit 與最高位的距離亦會相應拉遠,以防投資者被波動的市況震走。但凡事有利亦有弊,止賺位較遠的缺點就是一旦觸及,代表價格已由最高位下跌了不少,採用 Chandelier Exit 的投資者不可能在市場的頂部附近平倉。
計算 Chandelier Exit 時,一般採用 3倍 ATR,但投資者也可以嘗試 2.5 或 3.5倍,看看效果如何。
現貨金 - Chandelier Exit
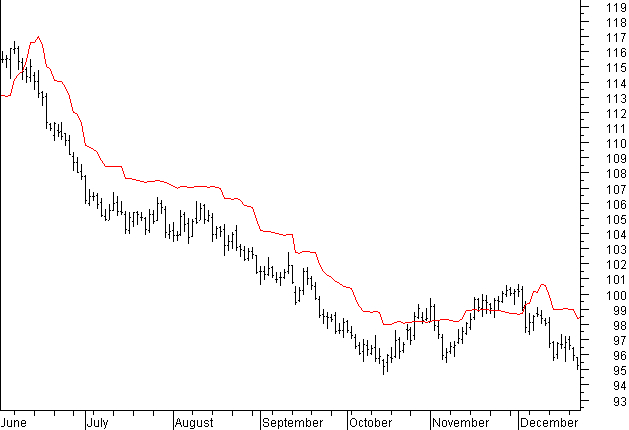
另外,如果投資者持有淡倉,Chandelier Exit 的計算方式將稍有不同:
Chandelier Exit = 過去 20天的最低價 + 3‧20天 ATR
美元兌瑞士法郎 - Chandelier Exit for short position


3 則留言:
Nice Post. This post helped me in my college assignment. Thnaks Alot
"想像你是順勢交易者,預期金市將出現大升浪,於是在 09年 9月初進場,然後金價果然節節上升。一切看來都很完美,但可惜你選擇了 SAR 作為你的出場訊號,SAR 在 9月 21日發出止賺訊號,你只好在 995美元附近「止賺」,眼巴巴看著金價最後升至 1226美元!"
If we consider trendlines as well, one can also enjoy the same big rally.
After closing the position@995, there is actually another chance to open a new position.
The day the "bearish-SAR" is break, it is also a breakout of downward trendline.
One could be able to open position at 1000~1010 which can also enjoy the rally until 1050.
Repeating the above strategy, open again at about 1050~1060, and close again at 1150~1200.
Although it means more trades, IMO is better for the trader mentally because he avoided the consolidation periods.
你說得對, 對於swing trader來說, 不愁沒有再進場的機會, 只是對於偏愛中長線的trend follower來說, chandelier exit較SAR更適合他們.
張貼留言